
Vendors and buyers keep asking some version of the same question: “What is the market doing?” A headline gives them a national average. A weekly video from the real estate agent who works their street gives them something closer to home, and a reason to message you.
The weekly market update is easy to plan and hard to keep up, because finding the number, writing the script, filming and editing takes an evening. This post turns the first two jobs into a routine, then shows three ways to make the video: your AI agent edits your takes, or makes it with an AI presenter or an animated chart.
The method: one number, one place, one answer
Five numbers make a report. One makes a video. Pick one figure, one place and one thing the viewer can do, and build the 55 seconds around them.
- One number
The single figure that matters this week: a median price, a clearance rate, a vacancy rate, or how many days your own last sales took. Say it once, early, and show it on screen.
- One place
A suburb, a postcode or a region your viewers would recognise. A number about the country is news. A number about their street is a reason to stop scrolling.
- One answer
What a seller does, or what a buyer does, because of the number. “So what do I do?” is the question under every market update, and the answer is the part nobody else gives them.
Keep that order. The number earns the first three seconds, the place tells locals the video is for them, and the answer is why they watch to the end.
Say which index, and when
Cotality (formerly CoreLogic), Domain and PropTrack each use their own data and method. Domain reports median sale prices. Cotality and PropTrack publish indices that account for the features of the homes that sold. So the same suburb can show a different figure from each in the same month, and all three can be right.
What costs you trust is not saying which one you used. Put the source and the period on screen and say them out loud: “Domain’s House Price Report, September quarter.” Use one source per video, and the same source from week to week, so a change in the number is a change in the market and not a change of index.
Where the numbers come from
Each of these publishes to a schedule, so you always know when the next number is due. Open the page on the day you film and read the figure from it.
| Source | What it gives you | How often |
|---|---|---|
| RBA | The cash rate decision, and the dates of the next meetings | Eight meetings a year, with the decision at 2.30 pm |
| Cotality | The Home Value Index, and weekly auction clearance rates | Index updated daily and revised each month. Auction results by Sunday morning, final rates on Thursday |
| Domain | The House Price Report: median house and unit prices | Quarterly |
| PropTrack | The Home Price Index at national, state and regional level | Monthly |
| SQM Research | National vacancy rates and total property listings | Monthly |
| REIWA | Perth and regional Western Australia: market data and a weekly Perth snapshot | Weekly snapshot |
| REIQ | Queensland sale prices and rental vacancy rates, in its media releases | Quarterly |
| ABS | Lending indicators: new home loan commitments, including first home buyers | Quarterly |
Most index figures are for a city or a region. For a suburb, use the property data service your agency subscribes to, and for the most local number of all, use your own results: how long your last five sales took, or how many groups came through on Saturday. Say “our listings”, not “the suburb”, so the line stays true.
A 55-second script with blanks
Seven lines, each short enough to say in one breath. Fill the blanks from your source page. Read each line twice if you are filming, or hand the script to your AI agent.
Suburb houses rose, fell or held steady: the number over the period. Here’s what to do about it.
According to the source, the measure in the place is the figure, to the end of the month or quarter.
That is higher or lower than last quarter, the next suburb or our own sales. One local detail: a street, a school zone, a new development.
If you’re selling, one action.
If you’re buying, one action.
Source: the source and the date. General information only, not financial advice.
Your offer: an appraisal, a buyer list, Saturday’s open home. How to reach you.
The two action lines carry the video. Make each one something a person can do this week, for example:
- Sellers: price to this week’s number, not last season’s.
- Sellers: compare your home with the recent sales on your street first, then the suburb.
- Buyers: check your pre-approval is still current before the next inspection.
- Buyers: book building and pest before the auction, not after.
Keep it general. A market update talks about prices and rates, and people act on what they hear. “General information only, not financial advice” tells them that is what it is. Say what the number shows and what it means for a seller or a buyer in general terms. Leave out predictions, and leave the question of which loan to take to a mortgage broker or the buyer’s lender.
Three ways to make it
The method works the same whichever way the video is made. Pick by how much of you the video needs.
Film it yourself
Stand in the street the update is about, phone at eye level, and read the script twice. Your AI agent picks the best take of each line, cuts the pauses, puts the figure and its source on screen when you say them, and ends on your brand card.
Edit my takes in the footage folder into a 55-second market update: best take of each line, cut the pauses, captions on, put the figure and its source on screen when I say them, and end on my logo and phone number.
Use an AI presenter
An AI-generated presenter, never you, reads the script in front of a street that looks like yours, with the figure and the source on screen. Switch on the platform’s AI label when you post: AI presenter videos explains how.
Make a 50-second vertical market update for Parramatta: an AI presenter on a street corner reads the median house price from Domain’s House Price Report, September quarter, which I will paste in with its link. Show the figure and the source on screen, and end on my logo and number.
Animate the number
Let the figure be the star: a scoreboard, a chart, even a weather report, in any look from the template library. There is nobody to film, and the number stays on screen for as long as you like. If the voice-over sounds like a real person, check the platform’s label rule for realistic AI audio.
Make a 45-second vertical animated market update for Parramatta: a scoreboard of this week’s auction clearance rate against last year’s, with the source and date on screen, and end on my logo and number.
A rhythm for the month
The numbers arrive on a pattern, so the videos can too. This is only what each page showed in November 2026, and dates move, so check the page before you plan around it. In a week with no new number, use your own: your last five sales, or Saturday’s open home.
| When | What comes out | A video to make |
|---|---|---|
| Every Sunday | Cotality’s preliminary auction clearance rates for the week | Saturday’s scoreboard |
| Every Thursday | Cotality’s final clearance rates | The finished week, and what changed since Sunday |
| Every month | Cotality’s month-end values (the index is revised on the 1st) and PropTrack’s monthly report | Last month in your suburb |
| Mid-month | SQM Research’s national vacancy rates | A rental update for landlords and tenants |
| After each quarter | Domain’s House Price Report, REIQ’s releases and the ABS lending indicators | The quarter in review |
| Eight times a year | The RBA’s cash rate decision, at 2.30 pm | A rates day video that morning: whatever the RBA decides, here is your next move |
Your next step
The PDF below turns this into a weekly habit: the method on one page, the week, twelve formats with a hook for each and a scorecard to show which updates bring in messages. Pick the one number for this week, name its source and make the first update. For the system around it, read the real estate video system, and to see a video made for one of your listings first, your first video is free.
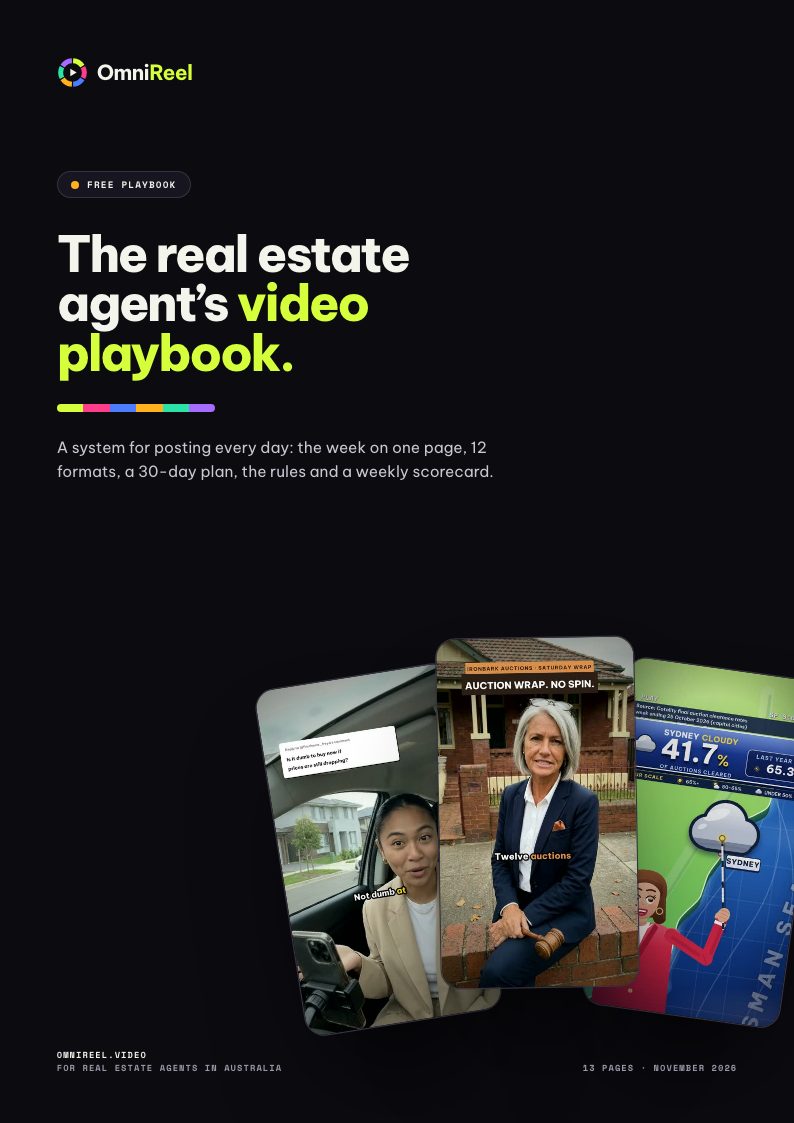 Free playbook · 13 pagesThe real estate agent’s video playbookA system for posting every day: the week on one page, 12 formats, a 30-day plan, the rules and a weekly scorecard.Get the free PDF